
Cathie Wood's disruptive innovation exposure map
Allocate a hypothetical amount across the five innovation platforms Cathie Wood named and inspect concentration without pretending to reconstruct an ARK fund.
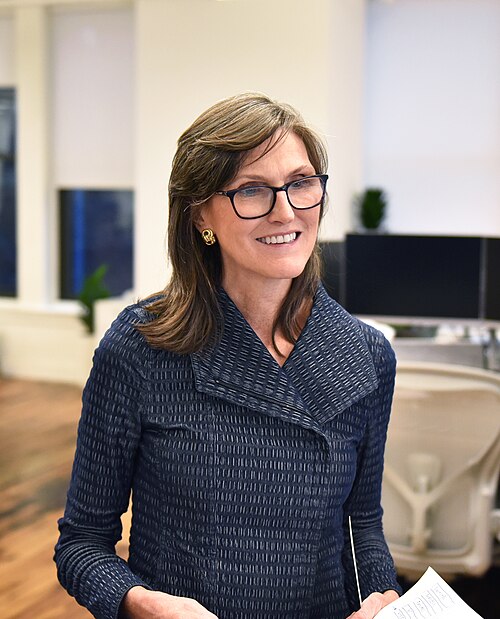 Cathie Wood Historical strategy from 2023 Rule located in ARK Invest, 2023
 Portrait: Caroline Wood, CC BY-SA 4.0, via Wikimedia Commons. Self-hosted by JMM.

Put your numbers through the rule
The source establishes the rule. The values below belong to you, and the output is JMM's deterministic calculation.
Every field recalculates immediately. Changed values can be copied into a shareable URL.
- Weight total
- 100.0%
- Concentration index
- 0.2
- Effective equal-weight count
- 5
This is a user-authored theme map. It is not an ARK fund, security list, or return forecast.
Multiomics sequencing
- Weight
- 20.0%
- Hypothetical dollars
- $20,000
Robotics
- Weight
- 20.0%
- Hypothetical dollars
- $20,000
Energy storage
- Weight
- 20.0%
- Hypothetical dollars
- $20,000
Artificial intelligence
- Weight
- 20.0%
- Hypothetical dollars
- $20,000
Blockchain technology
- Weight
- 20.0%
- Hypothetical dollars
- $20,000
What the source says, and what the calculator adds
 Source-supported ruleWood names multiomics sequencing, robotics, energy storage, artificial intelligence, and blockchain technology as five converging innovation platforms.
  JMM calculationJMM turns the taxonomy into a user-controlled exposure map with dollar allocation, concentration, and sum checks.
 What changes the answer
A theme map is not a portfolio
The named platforms organize research ideas. Securities can touch several platforms, so apparent diversification can overstate independent exposure.
Concentration is visible, not judged
The Herfindahl measure describes how weights are distributed; it is not a universal good-or-bad score.
Five platforms, one bet. The convergence that makes the thesis exciting is what removes the diversification.
Wood’s framing is genuinely useful as a research map: these five areas do feed each other, and organising coverage around them beats organising it around sector codes. As a portfolio construction tool it is close to the opposite of what it looks like. The whole argument is that the platforms converge, which means the same handful of companies show up in several of them, which means five buckets at 20% each is not five independent exposures. Watch the concentration number on this page while you move the weights: it barely moves, because the map was never a diversifier. It is one long-duration growth bet wearing five labels.
Not the calculator’s limits. The rule’s.
Convergence and diversification are opposites
The thesis and the portfolio pull in different directions. If the platforms really do converge, they share drivers, and a shock to rates or risk appetite hits all five at once.
Platforms are not investable without a security selection step
You cannot buy energy storage. You buy companies, each of which carries balance sheet, competition and valuation risk that the theme map does not describe.
What this model does not know
- The source does not prescribe equal platform weights.
- Themes overlap and are not securities, sectors, or mutually exclusive risk buckets.
- The map does not reproduce ARK holdings or estimate returns.
Before you use the result
Are equal weights Cathie Wood’s recommendation?
No. Equal weights are only the editable first-load scenario.
Can one company belong to several platforms?
Yes. The source emphasizes convergence, which makes overlap an important limitation.
The next question this page cannot answer
-
 Calculator Portfolio volatility calculator
 What concentration in correlated themes does to portfolio volatility, which an exposure map alone cannot show.
Open → -
 Calculator Max drawdown calculator
 The recovery arithmetic behind a high-volatility allocation: the gain each loss requires to get back to level.
Open → -
 Cathie Wood, sourced rule Five-year return hurdle calculator
 The return this exposure has to earn to justify the volatility, stated as the source states it.
Open →