
Warren Buffett's investment fee-drag calculator
Compare a low-cost fund with a higher-fee strategy under the same gross return and expose both direct fees and the compounding those fees lose.
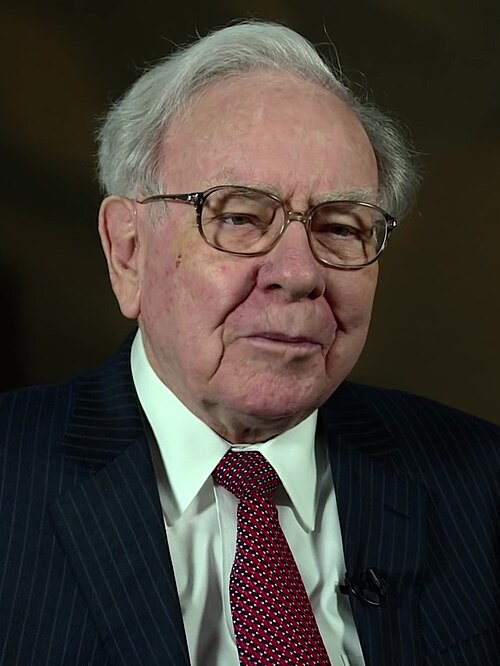 Warren Buffett Historical strategy from 2017 Rule located in Berkshire Hathaway, 2017
 Portrait: USA International Trade Administration, Public domain, via Wikimedia Commons. Self-hosted by JMM.
.jpg)
Put your numbers through the rule
The source establishes the rule. The values below belong to you, and the output is JMM's deterministic calculation.
Every field recalculates immediately. Changed values can be copied into a shareable URL.
- At 0.05% fee
- $1,766,038
- At 1.25% fee
- $1,325,183
- Required gross alpha
- 1.2%
Both paths receive the same gross-return assumption; only the annual fee changes.
Low-cost path
- Net return
- 7.0%
- Ending value
- $1,766,038
Higher-fee path
- Net return
- 5.8%
- Ending value
- $1,325,183
What the source says, and what the calculator adds
 Source-supported ruleBuffett argues that costs create a persistent aggregate handicap and recommends a low-cost S&P 500 index fund for nonprofessionals.
  JMM calculationJMM holds gross return constant to isolate the fee difference, including the growth the removed dollars can no longer earn.
 What changes the answer
A small annual number compounds into a large gap
The calculator expresses the fee in ending dollars because percentages alone hide the foregone growth on every prior fee payment.
Required alpha is the fair comparison
A higher-fee strategy must earn enough additional gross return to recover its fee handicap before it creates a net advantage.
The most reliably correct piece of advice on this site. Fees are the one variable you control.
Nothing else in investing offers a known, permanent, risk-free improvement to your return, and this one does: a fee you do not pay is a return you keep, every year, on a base that keeps compounding. Buffett backed the argument with his own money and won the wager publicly. JMM would not spend a second arguing the principle. The only useful question left is the one this calculator asks: how large is the fee gap on your actual accounts, and does the higher-cost option have a reason to exist beyond being sold to you.
Not the calculator’s limits. The rule’s.
A fee difference is not a manager comparison
The model holds gross return equal, which is exactly what makes the fee visible and exactly what a real comparison cannot assume. A strategy with a genuine edge can be worth paying for; the fee just sets how big that edge has to be.
Cheapest is not the same as best
Chasing the lowest expense ratio into a fund that tracks something you did not intend to own is a worse mistake than paying five extra basis points. Cost is a tiebreaker between equivalent choices, not the choice itself.
What this model does not know
- Real active strategies can have different gross returns, turnover, taxes, fee schedules, and risk.
- Performance fees, high-water marks, and transaction costs are not modeled.
- The result is a scenario, not a forecast for a named fund.
Before you use the result
Are fund fees charged once a year?
Funds accrue expenses through the year. Monthly modeling is a transparent approximation.
Does a high fee prove a fund is bad?
No. This page isolates the hurdle the fee creates; it does not judge a particular manager.
The next question this page cannot answer
-
 Calculator Compound interest calculator
 The same compounding without the fee, so the gap this page measures can be seen against the gross path.
Open → - Guide What active trading costs in tax, before it has beaten anything
The cost fees are usually paired with and rarely counted beside them: the tax bill activity creates before any fee is charged.
Open → -
 Warren Buffett, sourced rule 90/10 portfolio model
 The allocation the same source recommends, from the same letter, once the fee argument is settled.
Open →
Keep researching Warren Buffett
Open the verified role and source record behind this historical strategy.
Another Warren Buffett ruleOwner earnings calculatorWhat cash can a business distribute without weakening its position?
Another Warren Buffett ruleFive-year earnings range testIs the lower end of your five-year earnings range reasonable at today’s price?